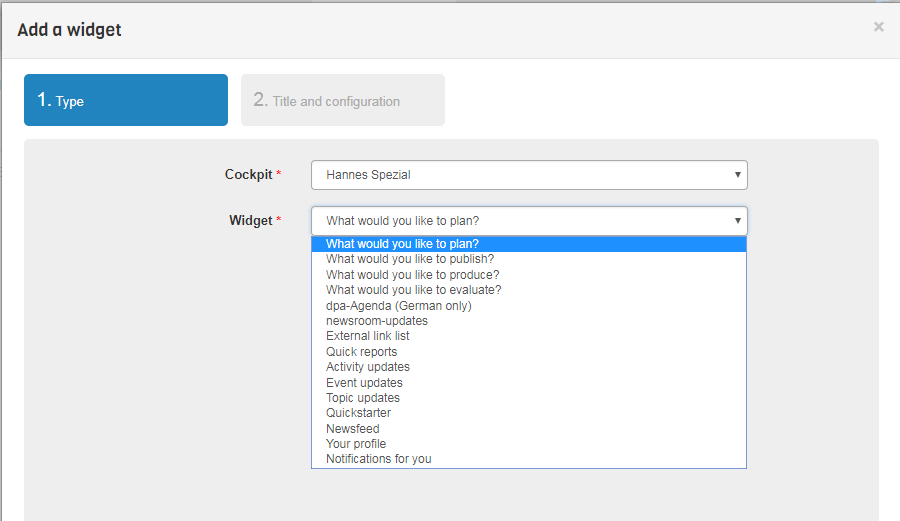
These widgets are available for the cockpit pages:

What do you want to plan ?
The widget “What do you want to plan?” includes all features needed to create new topics, events or activities. It will also create lists of all your existing topics, events and activities.
What do you want to produce?
The widget “What do you want to produce?” contains all features needed to create new content or to edit or to finish existing content.
What do you want to publish?
The widget “What do you want to publish?” opens lists of activities containing finished Content. These can be selected for publication.
What do you want to evaluate?
The widget “What do you want to evaluate?” opens options to research newsroom data. Optional, it can also include interfaces to media analysis service providers such as UNICEPTA.
dpa Agenda
The widget dpa agenda contains features to open or edit Event data provided by dpa’s event database (optional for customers of dpa).
newsroom Updates and Info
The “newsroom Updates and Info” widget provides information from the developer team. There are 4 tabs in the widget. There are no configuration options. Content:
• Developer Blog (TBD)
• Changelog (changes since last update)
• Upcoming features (outlook for new features)
• System info (parameters of the client such as browser version, user agent, browser window size etc.) This information helps in case support is needed.
Link list
The widget “Link List” provides a feature to store and open links to (often used) web pages.
Quick Reports
The Quick Reports widget displays statistics of activities and events within a configurable period of time. You can configure four time periods:
• This week
• This month
• This quarter
• This year
For each time period is displayed:
• The events that start in the period
• The activities that take place in the period
• The status of the activities in a pie chart
• The number of activities in a bar chart.
Depending on the selected period, the reference unit changes.
◦ Period “This week”: The number of activities per weekday is listed.
◦ Period “This month”: The number of activities per calendar day is listed.
◦ Period “This quarter”: The number of activities per calendar week is listed.
◦ Period “This year”: The number of activities per month is listed.
Activity updates
The most recently added activities are displayed as well as the last modified activities. During the configuration, the user can define how many activities are to be displayed. As information, activity titel and publication date are displayed. Additional information: The business card of the user who added or changed the activity will appear by “mouseover” over the avatar. Clicking the title opens a modal providing information concerning the selected activity.
Event updates
The most recently added Events are displayed as well as the last modified events. During the configuration, the user can define how many Events are to be displayed. As information, Event titel and Event date are displayed. Additional information: The business card of the user who added or changed the Event will appear by “mouseover” over the avatar. Clicking the title opens a modal providing information concerning the selected event.
Topic updates
The most recently added Topics are displayed as well as the last modified Topics. During the configuration, the user can define how many Topics are to be displayed. As information, the Topic titel is displayed. Additional information: The business card of the user who added or changed the Topic will appear by “mouseover” over the avatar. Clicking the title opens a modal providing information concerning the selected Topic.
Quick starter
Using the Quicklauncher, the user can create buttons that enable him to quickly jump to desired functions within newsroom. During the configuration process, the user can specify which buttons are needed, for example, “Add new event” or “Add new activity “.
Newsfeed
The newsfeed widget uses the Pastebin API to display news from different, selectable sources. The configuration is used to specify from which sources the news is to be compiled. The feed is sorted by the publication date of the message. Clicking on the title will open the message in a new browser window to display the full text. The 10 latest messages are always displayed.
In addition, a key term can be specified to filter the messages. If this field remains blank, it will not be filtered. If, for example, the key term “Hannover 96” is entered, all news including the term “Hannover 96” will be displayed.
The configured sources and the key term are displayed in the widget.
Note: The newsfeed widget does not currently work on Internet Explorer.
Your Profile
The Welcome widget displays a small welcome screen. Time and date as well as the current time zone are being displayed. Additional available information: name of the user and the current role as well as his or her avatar (profile picture or combination of first letters of first name and last name). Two buttons enable you to either log out or to jump to “My Settings” to customize your user settings.
My Notifications
Like to the function that displays the notifications from the menu below the balloon, this widget also displays the personal notifications. The user has the option to set the number of notifications to be displayed.
My Tasks
The mytasks Widget provides an overview of your tasks linked to activities or events. The display has thre segments: Tasks today, tasks tomorrow, tasks later.
Kanban-Boards
The Widgets „Kanban-Board: Activities“ und „Kanban-Board: Tasks“ provide the option to visualize your processes in a special view focussed on process steps. The Widget „Kanban-Board: Activities” looks like this:

The Kanban Board “Activities” will show you the activities sorted in vertical status columns from left to right (e.g. new, canceled, in progress or finished). The horizontal lines are sorted along the publication dates planned for the actual week and (if selected) for the upcoming week. Simply move an activity card using the Drag & Drop function to change the status or publication date.
The “Kanban Board Tasks” will show you your tasks or those tasks that you have assigned to others. In addition, as an Editor in Chief you can get an overview of all tasks, actual and past ones. The columns of the board show the respective status (new, in progress, finished or cancelled) of the task. The horizontal lines provide information about the due date (today, tomorrow, later, past) of the task. Simply move a task card using the Drag & Drop function to change the status or due date of the respective task.
